
Crisis Note 2009-3: This is Not an Economic Crisis; This is an Economics Crisis
08/15/2009
(Work in progress)
This note was started in 2008; however, I have not had the time to finish my research.
Beside graphs, I also need to dig up the data to corroborate my thesis.
Following up on my first Crisis note from 2007 titled 'This is Not a Subprime Crisis' (still possibly the most succinct analysis of what happened to the world - I would strongly recommend re-reading it), I am calling this crisis an Economics Crisis. Yes, I mean that the global crisis (and current Currency Crisis) is a Failure of Macro Economics, nothing less. And it has been completely predictible.
To solve the crisis and put the world on a stable footing for the future, we must first understand the problems with Economics and its applications (especially to monetary policy), before we can fix the global economy. The various Central Banks of the world have shown no indication that they understand the root cause of the global crisis and, being baffled, have been muddling along with a variety of experiments.
Unfortunately for the world, the people in charge of this crisis are all professional economists, and are incapable of declaring themselves obsolete. What they are on is a sure path to failure and the conversion of a global crisis to a global disaster.
Let me first enumerate what this crisis is NOT:
This crisis is not:
- a subprime crisis
- a liquidity crisis
- a banking crisis
- a deficit financing crisis
- an wage crisis
- a housing crisis
- a CDO crisis
- a MBS crisis
- a credit crisis
- a leverage crisis
- a toxic asset crisis
- a Wall Street crisis
- a failure of the efficient markets theories
- a failure of bank regulation
- a failure of consumer protection
- caused by predatory lending
and a host of other symptons that the press and congress have "discovered" in their witch hunts.
What we need is a clean sheet understanding of economics. What follows next is a brief review of Macro 101. I will then expand this to cover the state of the world before the crisis, and make it clear as to what caused this crisis.
What we need is a clean sheet understanding of economics. What follows next is a brief review of Macro 101. I will then expand this to cover the state of the world before the crisis, and make it clear as to what caused this crisis.
The IS/LM model, Monetary Policy, and Central Banking
I'm lifting some stuff from http://en.wikipedia.org/wiki/IS/LM_model, and more from some Macroeconomics textbooks.
I'm lifting some stuff from http://en.wikipedia.org/wiki/IS/LM_model, and more from some Macroeconomics textbooks.
The IS/LM model is a macroeconomic tool that demonstrates the relationship between interest rates, real output in the goods and services market, and the money market. It was invented by John Hicks to summarize John Maynard Keynes' General Theory of Employment, Interest, and Money. It is commonly used in introductory Macroeconomics textbooks, and does a pretty good job explaining what it is that central banks do, and how they think.
Very simplistically:
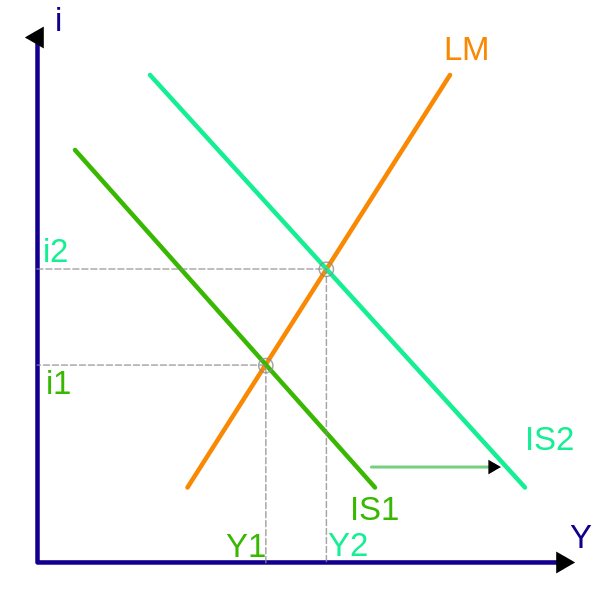
The horizontal axis (labeled Y) represents real GDP. The vertical axis represents nominal interest rates (labeled i).
The IS (Investment and Savings) curve shows the level of real GDP for each level of interest rates. Lower interest rates lead to more investment and less savings, leading to greater GDP, thus the IS curve is downwards sloping.
The LM curve represents the role of finance and money, and plots interest rates against the quantity of cash balances. ("Liquidity preference and Money supply equilibrium"). It represents the willingness to hold cash instead of securities. The LM curve is upward sloping. As GDP increases, and interest rates increase, so does the demand for cash.
Shifts to the IS curve:
- Change in government spending - increases will move the IS curve to the right.
- Increase in Marginal propensity to save - an increase will reduce the multiplier and move the IS curve to the left. (Interest rate changes impact saving and investment behavior – higher interest rates encourage savings, lower interest rates encourage investment. )
- Business and Consumer Confidence - greater optimism leads to more spending for any given interest rate, shifting the IS curve to the right.
Shifts to the LM curve:
- Monetary Policy decisions by the central bank - increases in the real money supply move the LM curve to the right.
- Real Money Demand - increases shift the LM curve up and to the left.
- Responsiveness of money demand to interest rates: changes the slope of the LM curve. Small responsiveness makes the LM curve be more vertical; large responsiveness makes it more horizontal.
- Real Money Demand - increases shift the LM curve up and to the left.
- Responsiveness of money demand to interest rates: changes the slope of the LM curve. Small responsiveness makes the LM curve be more vertical; large responsiveness makes it more horizontal.
To summarize, increases in GDP can be achieved by :
- Increasing government spending
- Increasing money supply, and the money multiplier
- Reducing propensity to save
- increasing risk taking and investing (done by lowering interest rates).
- Increasing money supply, and the money multiplier
- Reducing propensity to save
- increasing risk taking and investing (done by lowering interest rates).
For more details on how and why these curves were determined, see any Macroeconomics textbook. I'm using two: Robert J Gordon's, and Abel, Bernanke and Croushore. While every textbook and wiki disclaims that the IS/LM model has limitations, is simplistic, applies to closed models, etc, the following link makes it clear that the Central Banks' models, or at least the Bank of England's, are based on it.
The Transmission Mechanism of Monetary Policy
This white paper is excellent. I consider it mandatory reading.
http://www.bankofengland.co.uk/publications/other/monetary/montrans.pdf
Here’s a summary – :
- Central banks derive their power from the fact that they are monopoly providers of “high powered” money (base money). THIS IS IMPORTANT TO REMEMBER.
- Central banks choose the price (rate) at which they lend high powered money to the private sector.
- This official rate is transmitted to other market rates via the banking system to varying degrees, and impacts assets prices and expectations, as well as the exchange rate.
- These changes in turn effect spending, savings, and investment behavior, which impacts the demand for goods and services.
- Monetary policy works via its influence on aggregate demand in the economy. Monetary policy thus determines the general price level, and the value of money ie the purchasing power of money. (Inflation is thus a monetary phenomenon. )
- Changes in the policy rate lead to changes in behavior of both individuals and firms, which when added u p over the whole economy generate changes in aggregate spending.
- Total domestic expenditure in the economy is equal to the sum of private consumption expenditure, government consumption expenditure and investment spending. This, plus the balance of trade (net exports) is equal to GDP.
- Monetary policy changes affect output and inflation, as well as inflation expectations. - Inflation expectations influence the level of real interest rates and so determine the impact of any specific nominal interest rate. They also influence price and money wage setting, and so feed into actual inflation in subsequent periods.
- Money supply plays a role in the transmission mechanism of policy, but is not a policy instrument nor a target, as the central bank has an inflation target, and uses monetary aggregates as indicators only.
- There is a positive relationship between monetary aggregates and the general level of prices. - “Monetary growth persistently in excess of that warranted by growth in the real economy will inevitably be the reflection of an interest rate policy that is insistent with stable inflation. So control of inflation always ultimately implies control of the monetary growth rate. However, the relationship between the monetary aggregates and nominal GDP ..appears to be insufficiently stable (partly owing to financial innovation) for the monetary aggregates to provide a robust indicator of likely future inflation developments in the near term.”
- Shocks to spending can have their origin in the banking system, that are not directly caused by changes in interest rates
– Examples include declines in bank lending caused by losses of capital on bad loans: a credit crunch.
– Examples include declines in bank lending caused by losses of capital on bad loans: a credit crunch.
Liquidity Traps and Quantitative Easing
Standard monetary policy hopes to stimulate an economy via a reduction in interest rates. However, if an economy’s money supply and GDP become insensitive to interest rates (due to, for example, a credit crisis as described above), and monetary policy is unable to stimulate the economy, then that economy can be considered to be in a liquidity trap.
In IS-LM model tems, the slope of the IS curve is vertical – ie changes in interest rates have no effect on GDP.
Neoclassical (Keynesian) economists assert that even under an occurrence of a liquidity trap, expansive monetary policy can still stimulate the economy via the direct effects of increased money stocks. This is known as quantitative easing – the creation of new money to increase money supply, and it is employed when interest rates are at zero.
In practical terms, the central bank purchases financial assets (mostly short-term from financial institutions using money it has created out of nothing, via its open market operations. This is effectively “printing money” by increasing the central bank’s balance sheet. The goal is to attempt to seed the financial system through deposit multiplication by encouraging lending to stimulate the economy.
Risks to quantitative easing are considered to be that banks will still refuse to lend, or that the policy will be too effective and lead to hyperinflation.
I will contend that economists have missed the most important risk of quatitative easing - the creation of inflation elsewhere - I will elaborate on this subsequently.
Japan in the 1990s is considered to have been in a liquidity trap. More recently, most western nations (US and Europe) have been stuck in liquidity traps as well. The central banks of Japan, US and Europe all also embarked upon quantitative easing in response, with a stupendous lack of success. Japan’s public debt exploded, and much of government spending was of the Keynesian kind, on unneeded infrastructure and government guaranteed jobs (window watchers). The US has followed in this irrational behavior through the purchase of bonds in the central banks SOMA portfolio.
One last concept: Interest Rate Parity
Interest rate parity is an economics concept, expressed as a basic algebraic identity that relates interest rates and exchange rates. Interest rate parity is a non-arbitrage condition which says that the returns from borrowing in one currency, exchanging that currency for another currency and investing in interest-bearing instruments of the second currency, while simultaneously purchasing futures contracts to convert the currency back at the end of the holding period, should be equal to the returns from purchasing and holding similar interest-bearing instruments of the first currency. If the returns are different, an arbitrage transaction could, in theory, produce a risk-free return.
Looked at differently, interest rate parity says that the spot price and the forward or futures price of a currency incorporate any interest rate differentials between the two currencies - the cost of carry or financing offsets any potential arbitrate.
So why is all this basic economics in a Crisis Note?
Keynes died in 1946. Most economic theory was written before that.
The fundamental problem with macro economic theory is that it was written in an era when nations controlled their money supply, fiat money for the most part did not exist, foreign exchange was not easily traded, and moving capital between countries required permissions from your government, not to mention high level connections.
Today, this is not the case. Capital can flow between nations at the click of a button, and anyone with a few thousand dollars, or even less, can open an account on forex.com.
Put another way, the IS-LM model is a single economy model.
Economists and governments have not updated their theories. It is my contention that central bankers are using flawed theory to create and manage policy.
To understand the US (and western economies for that matter), one needs to expand the theories above to account for multiple economies, multiple economies, and multiple central banks and money supplies. It’s really quite simple and obvious.
Modifing the IS/LM Model
Lets postulate a 2 economy world – Country A & Counrty B.
Normally, their central bankers would go about their duties, studying inflation, and hanging out in their ivory towers, or playing jazz. Whenever one country felt the need to adjust its interest rates, its FX rate vs the other countries currency would adjust. Imports and exports would adjust accordingly.
[insert charts]
Case A: Country A enters a Liquity Trap
[insert charts]
[insert charts]
Country A has cut its policy interest rate to 0, and its IS curve is now vertical. Country B is still pursuing normal monetary policy. When Country A’s easing does not succeed, A embarks on quantitative easing and prints money to increase deposits in banks.
The Shah Theorum: When One Economy Enters a Liquidity Trap, All Monetary Policy Fails Globally.
...to be continued...