
This document is subject to the Disclaimer in the Disclaimer Page linked above. Please read the Disclaimer in it's entirety. If you print this out, there is a Disclaimer at the end - please read that.
Summary and Conclusions
The scope of this analysis is vast, and it covers many topics that are linked.
* At its heart, this is an analysis and discussion of how Macro Economics and Money Supply works in today's world, and it has significant policy implications. It will challenge what you think you know about US and Global Economic History and how Markets work. You will need an open mind to understand the linkages and conclusions.
* I prove that the current practioners of Macro Economics - Central Banks - have their theory backwards. Macro Economics changed in 1999, and responses to policy have inverted since then.
* I believe that I have proven the hypothesis that I postulated in 2009:
The Shah Theorum: "When One Economy Enters a Liquidity Trap, All Monetary Policy Fails Globally"
* I also connect Macro and Micro Economics through this analysis, at least for the special case of a Liquidity Trapped Economy.
Money Supply and The Failure of Macro Economics
I analyze the Japanese and US Economies. The relationships that follow work well since the links between these two economies are almost completely market based, with almost no regulatory friction between them. Capital flows and currency prices between these countries have no impediments, and demonstrate, with surprising precision, micro- and macro-economics at work.
My analysis shows that:
* Under present Economic conditions, cutting policy interest rates reduces money supply and exacerbates recessions, resulting in stagflation and deflation. This has been the case for Japan for 23 years.
* This is the result of a global market for capital. Under such a market design, local interest rate policies cannot be expected to work, and they do not.
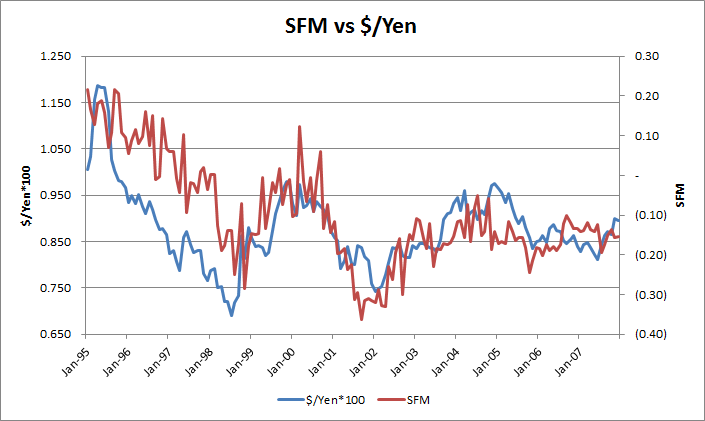
* The Carry Trade connects micro- and macro-economics: decisions by individuals to maximize their returns by seeking higher returns elsewhere drive capital overseas, altering money supply in both economies.
* Under Liquidity Trap conditions, Interest Rate Policy and Management fails in the Trapped Economy, and has the opposite outcome from the one desired by policy makers. Rate Cuts reduce Money Supply due to the Export of Capital and Savings, as investors seek higher returns in other economies. They also export the maximum amount of capital that they can. A significant proportion of extra Money Supply that is created from Quantitative Easing and other Non-Conventional Policy Measures is also exported.
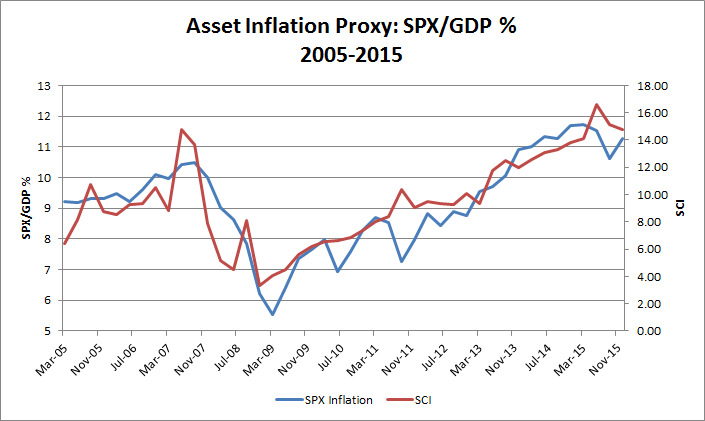
* Money Supply and Velocity in a Recipient Economy increases through receipt of capital from the countries that are in Liquidity Traps. Monetary Policy also fails in Economies that are recipients of Carry. They cannot control their money supply, and are subject to Asset Inflation from the import of capital. This is usually seen in Housing and Stock Market Prices. Rising asset prices increase debt issuance and leverage, further accelerating asset price growth. Economies become leveraged through debt issuance.
* If a Non-Trapped economy is already in a recession in spite of the receipt of Carry Money Supply, traditional policy measures such as cutting rates will have adverse impacts, as money supply will decline even more due to retraction of Carry, and this will eventually lead to it being Trapped too, in turn exporting its capital to other countries. This can lead to a global negative spiral of Trapped Economies.
* In other words, Monetary Policy fails in both Trapped Economies as well as Receiving Economies, and with time, All Economies.
* Money Supply Management though Policy Interest Rate changes no longer works, and has the opposite-to-desired result as it fuels Carry Trades. Central Banking Theory has been Inverted as a result of Japan entering its Liquidity Trap. Standard Monetary Policy is now impotent.
* Under Liquidity Trap conditions, the only way to increase Money Supply is through Quantitative Easing and increasing the size of Central Bank Balance sheets. This is highly inefficient as much of this will get exported, however, there is a chance some of the money supply thus created might remain resident.
The Pricing of Assets
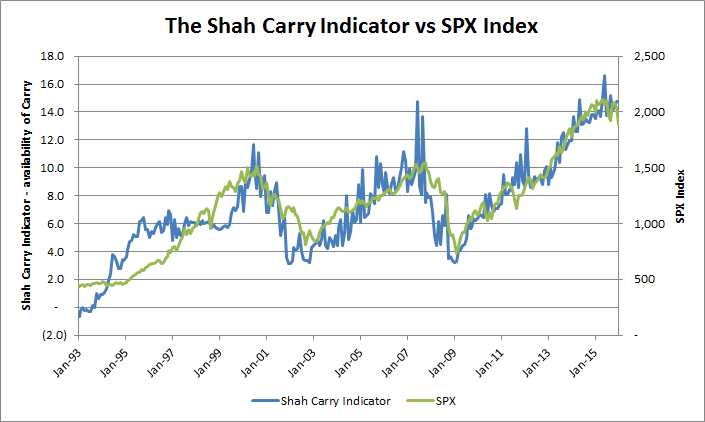
* While it is widely accepted that asset prices are influenced by money supply, what has changed since 1994 is that it is money supply and carry from global sources that determines asset prices, not just local money supply. Asset Pricing in an Economy is determined by the Total Supply of Carry available.
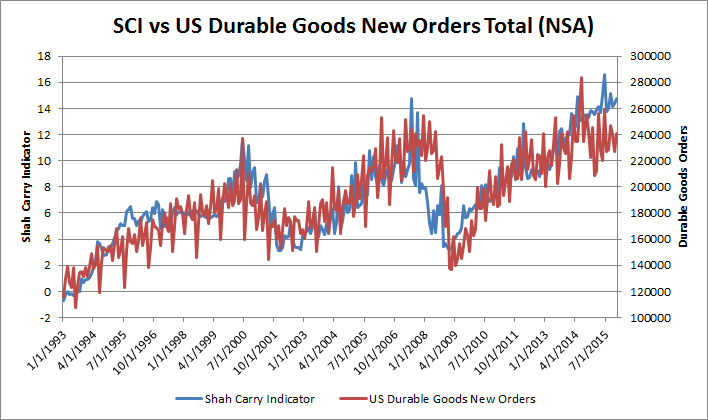
* I define the Shah Carry Indicator that captures Global Carry for an economy, and that explains the prices of many asset classes over long periods of time.
* Traditional valuation metrics of assets, such as expected returns, or discounted cashflows, are not necessary to explain asset prices and price movements.
Changes to Economic History - the US response to Policy Rates.
I analyze multiple periods between 1985 and 2015, and test the effectiveness of US Monetary Policy in each period. I confirm that, after 1999, when Japan entered into a Liquidity Trap, US Monetary Policy ceased to be effective, and instead had the opposite-to-desired effect on the US Economy.
The conventionally accepted US Economic history since 1999 is incorrect, as it does not take into account all the factors that impacted the US at the time. I correct this by completing the analysis of these periods. I also identify the parties responsible for the Great Financial Crisis.
The Present and Future
This analysis gives you the framework to analyze any period for any economy, and allows you to understand the economic impact of policy decisions. I have focused on developing the framework, and providing enough evidence to prove its validity, in the hope that this analysis can reach professional economists and Central Banks.
I briefly discuss some of the current themes and concerns in the market. These might get developed more fully in subsequent papers. After all, this document is already long enough.
Genesis of this Analysis
I have been formulating this analysis of Carry Trades and Assets since 2006, when I first researched Carry Trades to understand the Icelandic economy. The magnitude of the Carry Trade emphasizes its impact on markets and its importance to Macro Economics, which heretofore has not been appreciated. That the Carry Trade has inverted the practice of Macro Economics is not understood by most practicioners.
Many parts of this discussion are derived from my prior Crisis Notes (see the Archives) - I discuss the Carry Trade in almost every Crisis Note. The analytical framework that I have used since 1988 - that Hedging and Funding Costs and Flows determine Asset Valuation - has led me to research the supply of capital and the resulting impact on the prices of assets that are described herein. This is a very general framework that can be applied to any economy that is the recipient of Carry capital flows from a Funding Country or countries. I have been making the argument for many years that the US is the world's largest recipient of Carry Funding, primarily from Japan, and that the Global Financial Crisis was primarily a Carry Deleveraging event.
- Carry Trades - describes the various sources of Carry (from the US perspective)
- The Pricing of Assets - graphs showing the responsiveness of various US assets to Carry
- The Failure of Macro Economics - I use Carry to understand Money Supply, and how it redefines Economics. I also analyze different periods in US Economic history to see how Macro Economic policy has performed in each period. I define new tools and indicators to understand flows, currency movements and economic activity.
Important Notice - Disclaimer
This overview is being provided to you by MBS Mantra, LLC (“MBS Mantra” or the “Firm” or the “Adviser”), for informational purposes only, on a confidential basis and is intended solely for use by the company or individual to whom it is being delivered. Potential investors are advised to request and carefully read and review MBS Mantra’s Firm Brochure (Form ADV Part 2), and other documents, if any, provided by MBS Mantra (the “Documents”).
Under no circumstances should this overview be used or considered as an offer to sell, or a solicitation of any offer to buy, interests in any securities, funds, other financial products or investment strategies managed by MBS Mantra, nor shall it or its distribution form the basis of, or be relied upon in connection with, any contract for advisory services or otherwise.
The information contained with this brochure has not been audited and is based upon estimates and assumptions. No reliance should be placed, for any purpose, on the information or opinions contained in this overview. The information contained in this brochure is based upon proprietary information of MBS Mantra and public information, but it may not be comprehensive, and it should not be interpreted as investment advice. No representation, warranty or undertaking, express or implied, is given as to the accuracy or completeness of the information or opinions contained in this overview by MBS Mantra or by its affiliates and any of their principals, members, managers, directors, officers, employees, contractors or representatives.
Investors must make their own investment decisions based on their specific investment objectives and financial position. Charts, tables and graphs contained in this overview or in the Documents are not intended to be used to assist an investor in determining which securities to buy or sell or when to buy or sell securities. While this overview may contain past performance data, PAST PERFORMANCE IS NOT INDICATIVE OF FUTURE RESULTS, WHICH MAY VARY. There can be no assurance that any investment strategy will achieve its investment objective or avoid substantial or total losses. Except as required by law, MBS Mantra assumes no responsibility for the accuracy and completeness of any forward-looking statements. Further, MBS Mantra does not provide legal and tax advice; MBS Mantra recommends that investors consult with their own independent tax and legal advisers.
This overview and all Documents provided by MBS Mantra should only be considered current as of the date of publication without regard to the date on which you may receive or access the information. MBS Mantra maintains the right to delete or modify the information without prior notice; MBS Mantra undertakes no obligation to update such information, including, but not limited to, any forward-looking statements, as of a more recent date, except as otherwise required by law.