
Carry Trades, The Pricing of Assets, and The Failure of Macro Economics
1/28/2016
- * I believe that I have proven the hypothesis that I postulated in 2009:
- The Shah Theorum: "When One Economy Enters a Liquidity Trap, All Monetary Policy Fails Globally"
- * I also connect Macro and Micro Economics through this analysis, at least for the special case of a Liquidity Trapped Economy.
Money Supply and The Failure of Macro Economics- Using the examples of the Japanese and US Economies, I show that:
- * Under Liquidity Trap conditions, Interest Rate Policy and Management fails in the Trapped Economy, and has the opposite outcome from the one desired by policy makers.
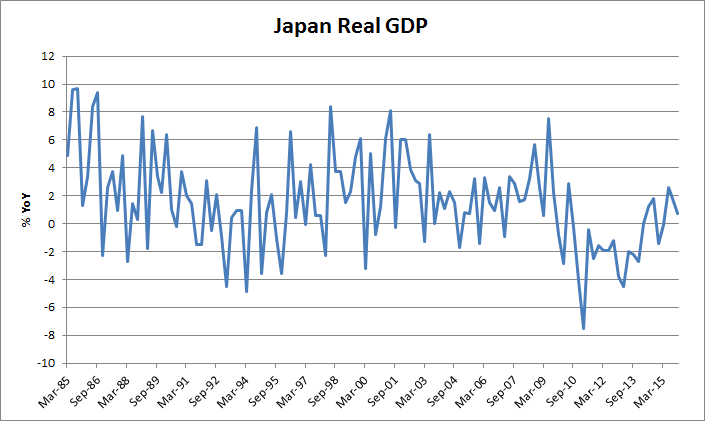
- * Cutting policy interest rates reduces money supply and exacerbates recessions. This has been the case for Japan for 23 years.
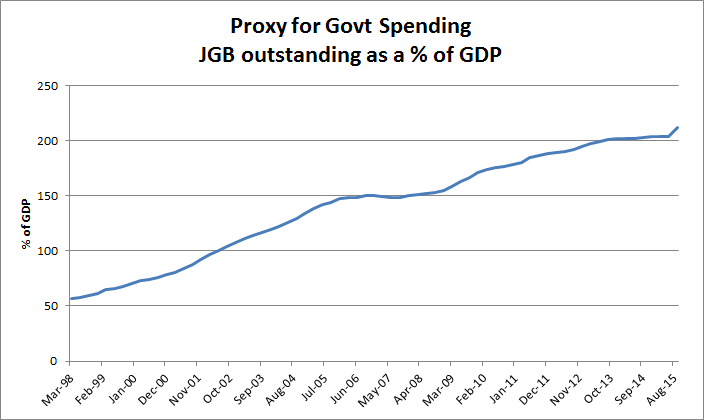
- * Money Supply in a Trapped Economy declines due to the Export of Capital and Savings, as investors seek higher returns in other economies. A significant proportion of extra Money Supply that has been created from Quantitative Easing and other Non-Conventional Policy Measures is also exported.
- * The Carry Trade connects micro and macro economics – decisions by individuals to maximize their returns by seeking higher returns elsewhere drives capital overseas, altering money supply.
- * Money Supply and Velocity in a Non-Trapped Economy increases through receipt of capital from the countries that are in Liquidity Traps. (There is a corresponding decrease in broad money supply and velocity in the Trapped country.) This determines the size of the Carry Trade.
- * Monetary Policy also fails in Economies that are receipients of Carry. They cannot control their money supply, and are subject to Asset Inflation from the import of capital. This is usually seen in Housing and Stock Market Prices. Rising asset prices increase debt issuance and leverage, further accelerating asset price growth. Economies become leveraged through debt issuance.
- * If a Non-Trapped economy is already in a recession in spite of the receipt of Carry Money Supply, traditional policy measures such as cutting rates will have adverse impacts, as money supply will decline even more due to retraction of Carry.
- * In other words, Monetary Policy fails in both Trapped Economies as well as Receiving Economies.
- * Under Liquidity Trap conditions, the only way to increase Money Supply is through Quantitative Easing and increasing the size of Central Bank Balance sheets. This is highly inefficient as much of this will get exported, however, there is a chance some of the money supply thus created might remain resident.
- The Pricing of Assets
- * Under Liquidity Trap conditions, Asset Pricing in an Economy is determined by the Total Supply of Carry available.
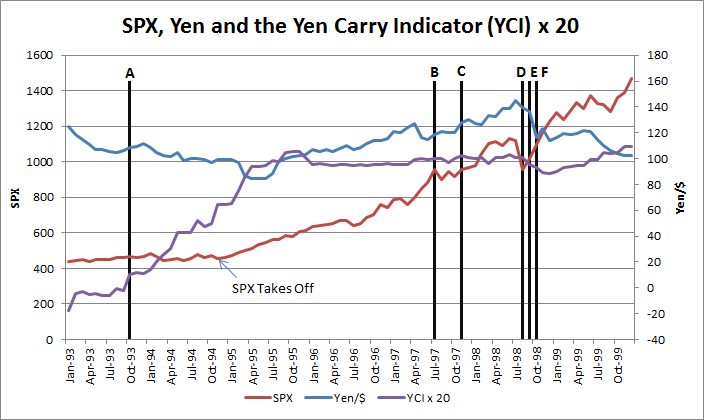
- * While it is widely accepted that asset prices are influenced by money supply, what has changed since 1994 is that it is money supply and carry from global sources that determines asset prices, not just local money supply.
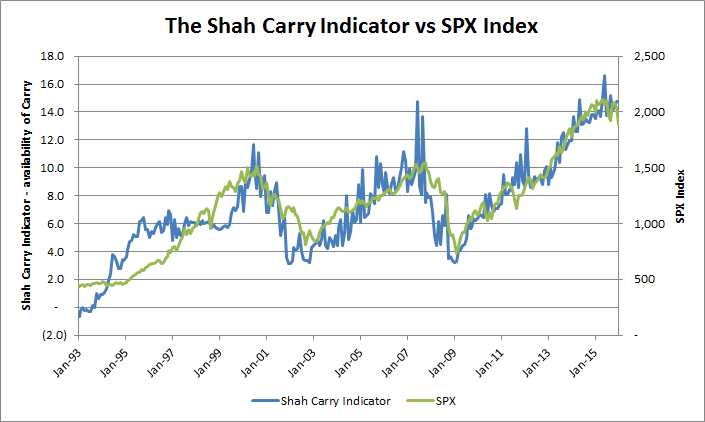
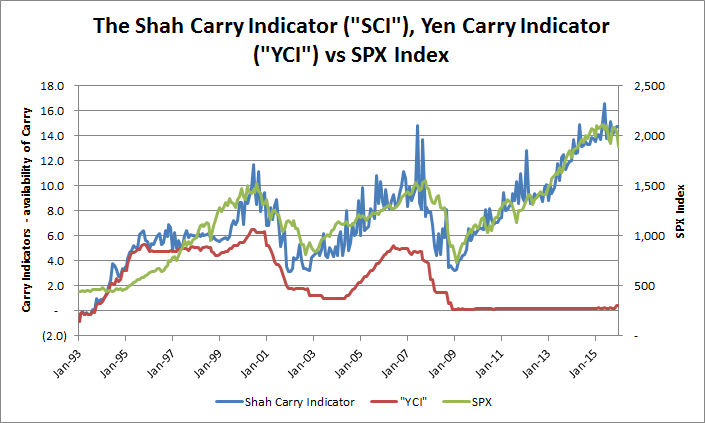
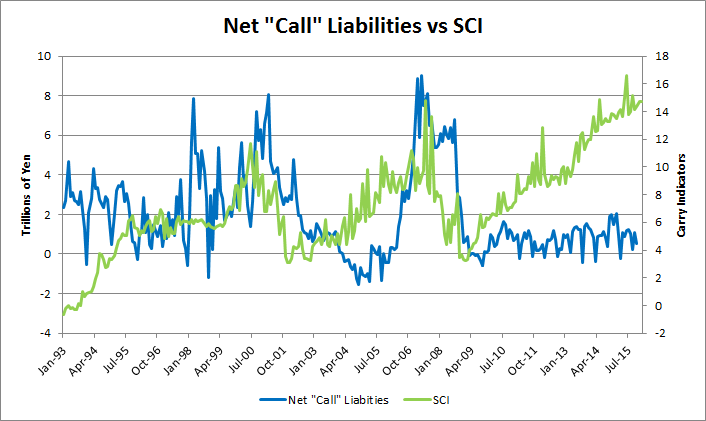
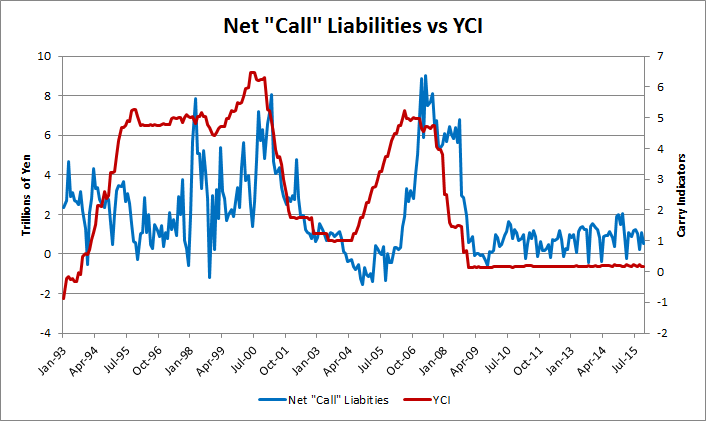
- * I define the Shah Carry Indicator that captures Global Carry, and explains the prices of many assets classes over long periods of time.
- * Valuation metrics of assets, such as expected returns, are not necessary to explain asset prices and price movements.
- * Different asset classes have different Beta’s or sensitivities to the Supply of Carry, but most Asset Prices are related.
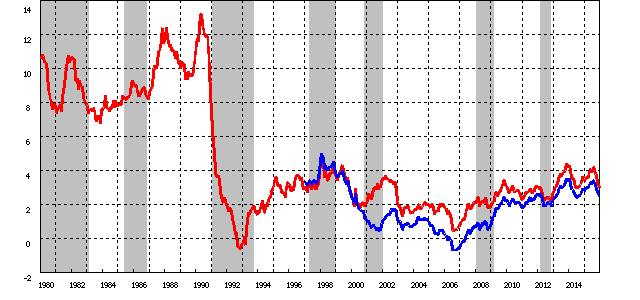
- Changes to Economic History - the US response to Policy Rates.
- - analysis of 2001 to 2004
- - analysis of 2007
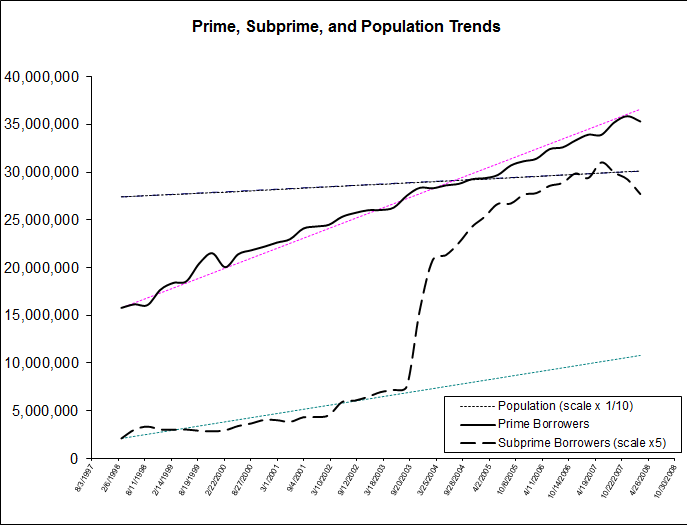
Social Implications- * Birth rates in Trapped Economies vs Birth rates in growing economies
- * Increases Income Inequality, as the owners of assets benefit in a leveraged manner. Leads to social unrest.
Genesis of this Analysis
I have been formulating this analysis of Carry Trades and Assets since 2006, when I first researched Carry Trades to understand the Icelandic economy. The magnitude of the Carry Trade emphasizes its impact on markets and its importance to Macro Economics, which heretofore has not been appreciated.
Many parts of this discussion are derived from my prior Crisis Notes (see the Archives) - I discuss the Carry Trade in almost every Crisis Note. The analytical framework that I have used since 1988 - that Hedging and Funding Costs and Flows determine Asset Valuation - has led me to research the supply of capital and the resulting impact on the prices of assets that are described herein. This is a very general framework that can be applied to any economy that is the recipient of Carry capital flows from a Funding Country or countries. I have been making the argument for many years that the US is the world's largest recipient of Carry Funding, primarily from Japan, and that the Global Financial Crisis was primarily a Carry Deleveraging event.
- Carry Trades - describes the various sources of Carry (to the US) at different points in time
- The Pricing of Assets - graphs showing the responsiveness of various US assets to Carry
- Macro Economics - the impact of the Carry on Money Supply and the Transmission of Policy
Section 1: Carry Trades
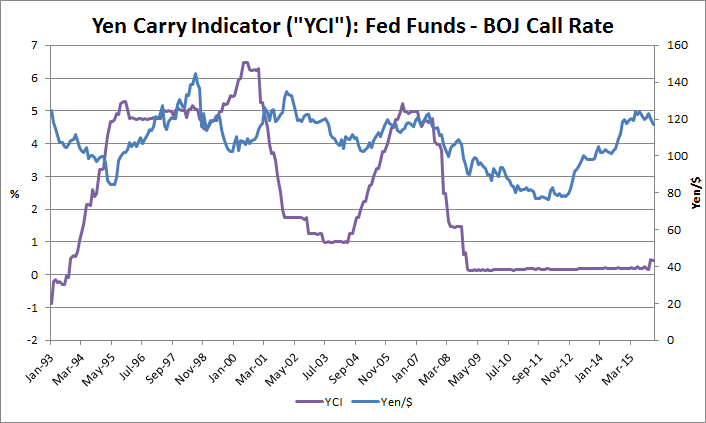
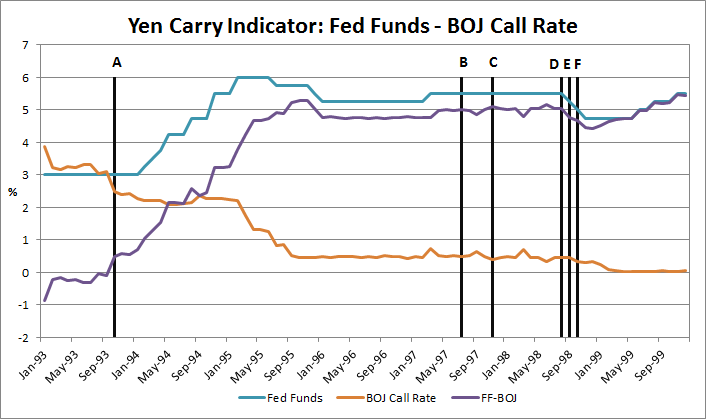
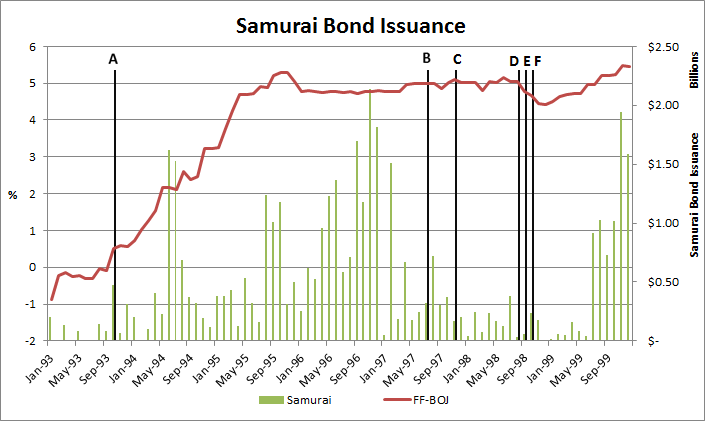
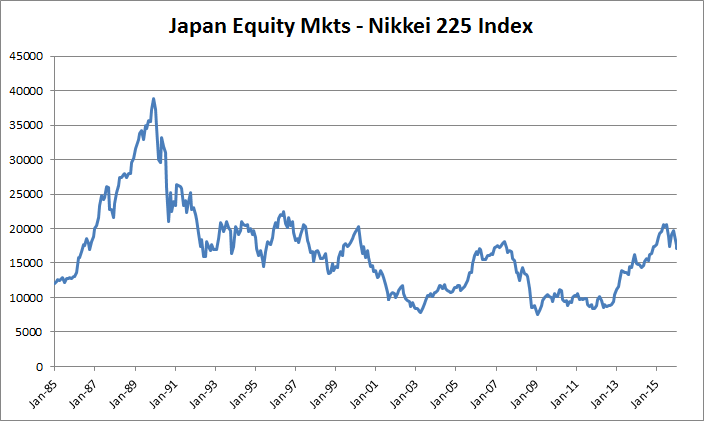
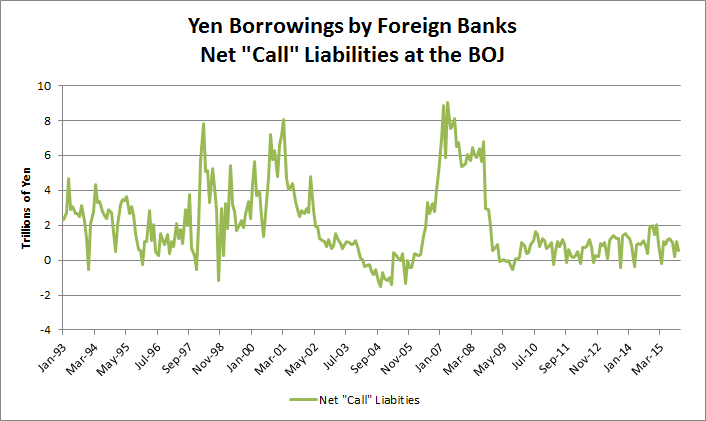
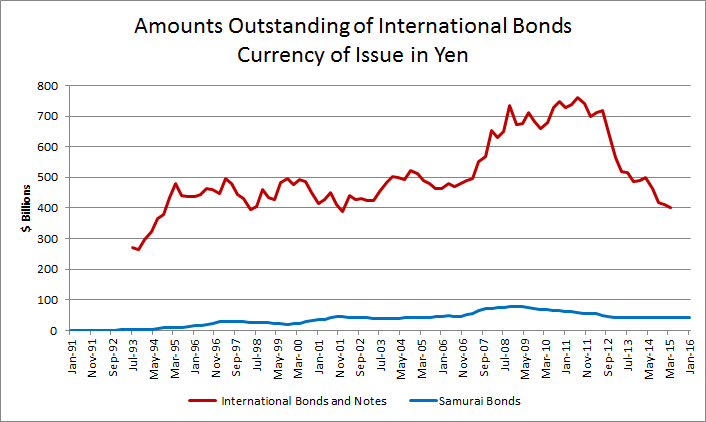
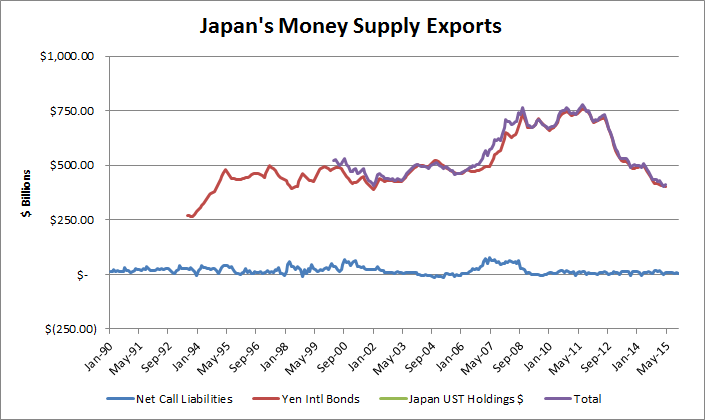
The Yen Carry Trade
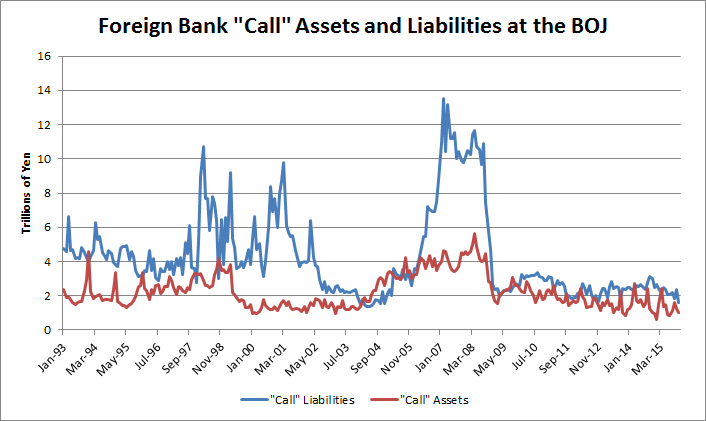
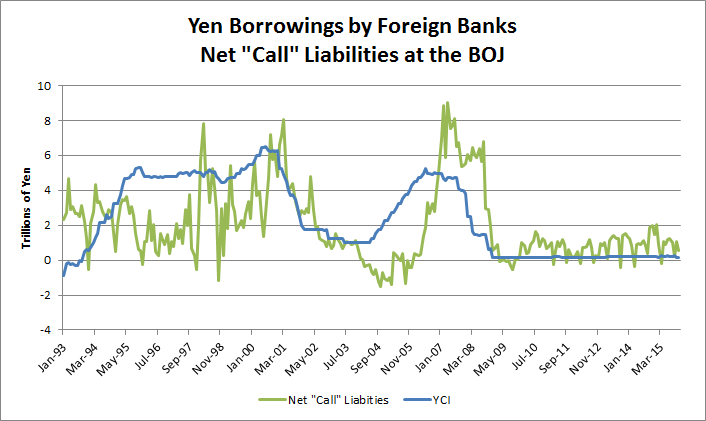
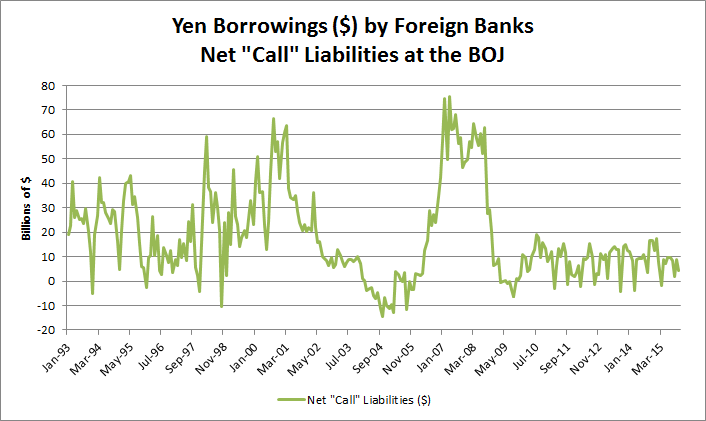
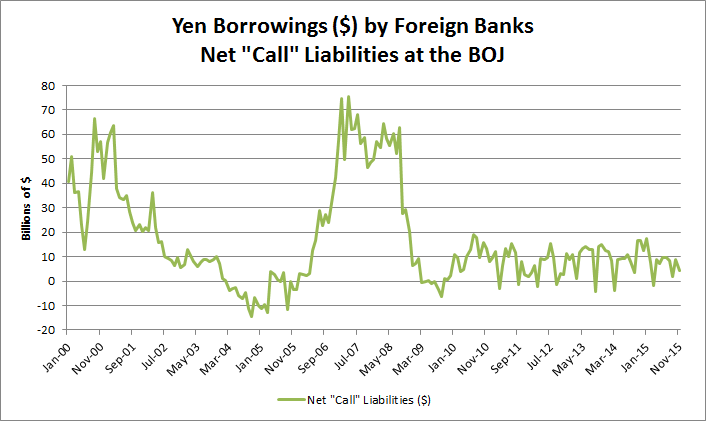
Borrowing by Foreign Banks from the BOJ
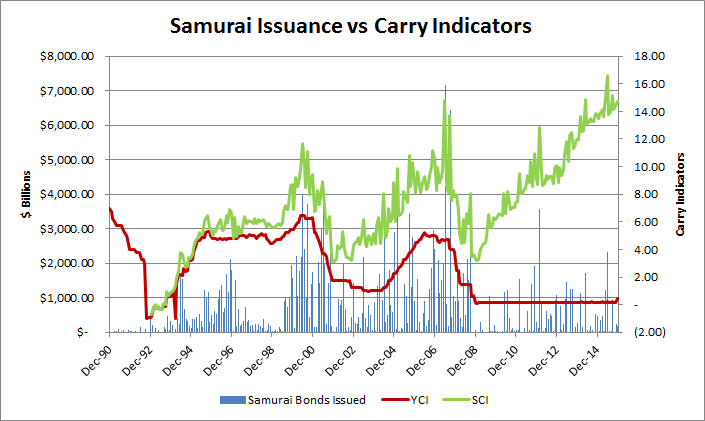
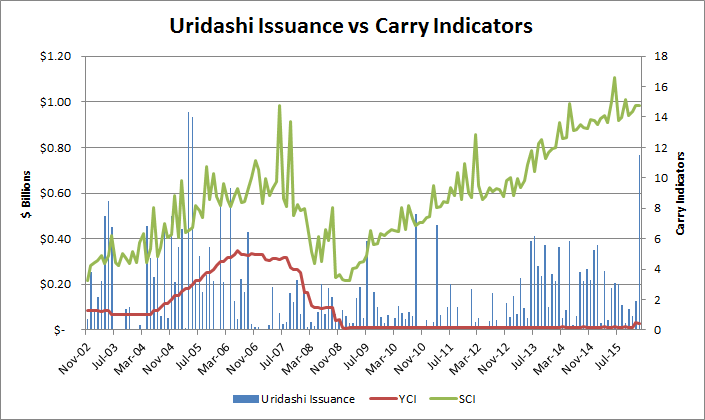
An Uridashi bond is a secondary offering of bonds outside Japan. They can be denominated in Yen or issued in a foreign currency. These bonds are sold to Japanese household investors. An Uridashi bond is normally issued in high-yielding currencies such as New Zealand Dollars or Australian Dollars in order to give the investor a higher return than the historically low domestic interest rate in Japan.During the 2008 financial crisis the carry trade and foreign currency bonds in general came under criticism in Japan for contributing to the crisis.
On the 1st of November, 2015 the size of the Uridashi Bond Market was USD 33.2bn equivalent in 15 different currencies.

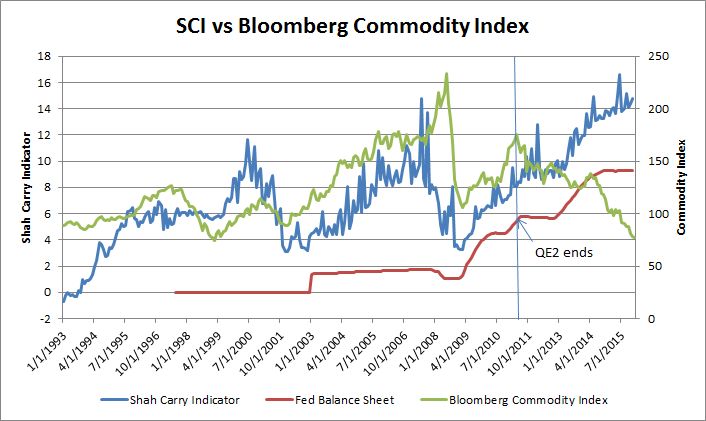
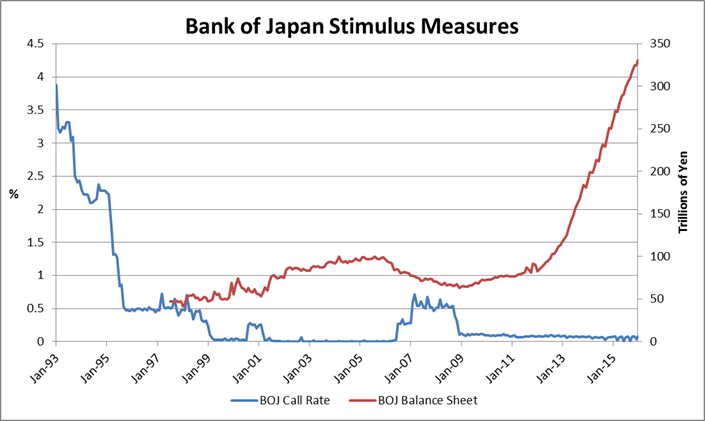
Quantitative Easing (QE) and Central Bank Balance Sheets
Wikipedia has a good definition for QE, so I will use it:
Quantitative easing (QE) is a monetary policy used by central banks to stimulate the economy when standard monetary policy has become ineffective. A central bank implements quantitative easing by buying financial asets from commercial banks and other financial institutions, thus raising the prices of those financial assets and lowering their yield, while simultaneously increasing the money supply.
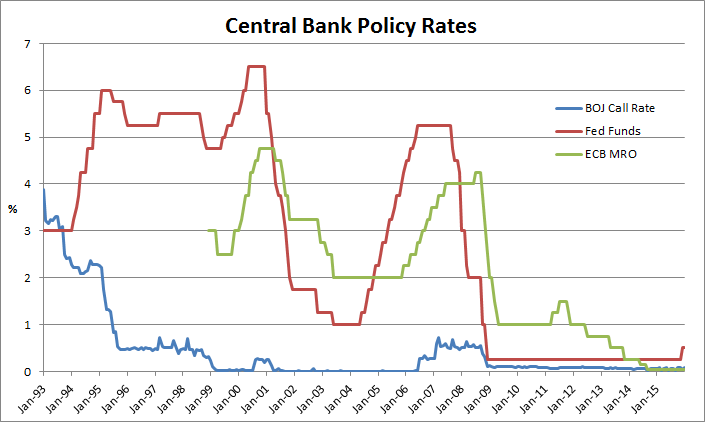
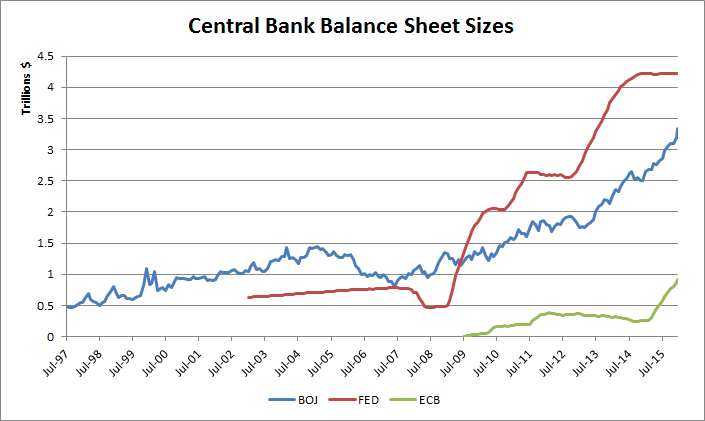
All three major central banks have resorted to QE, at different points in time, after entering Liquidity Traps. The extent of QE that they have implemented can be measured by the size of their (ballooning) balance sheets. The following chart shows the magnitude of their balance sheets (in USD). Combined, they currently total $8.5T, of which approximately $7.5T is as a result of QE.
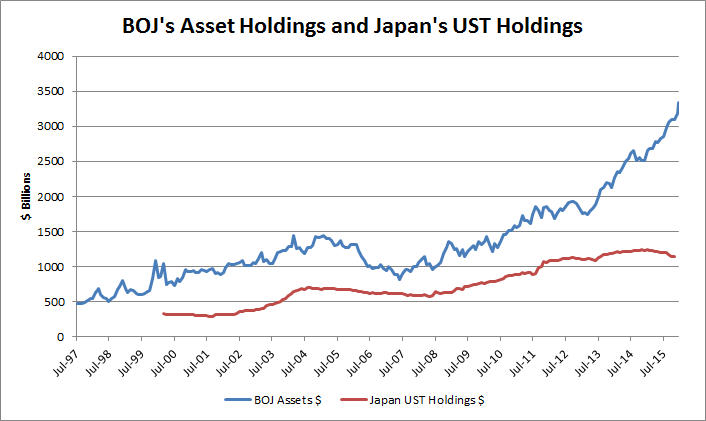
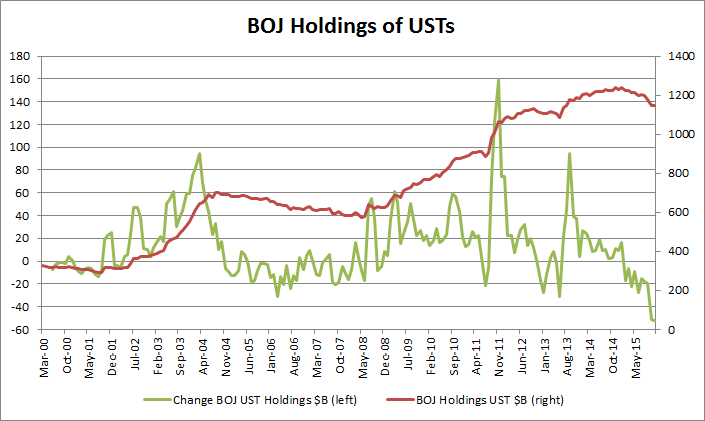
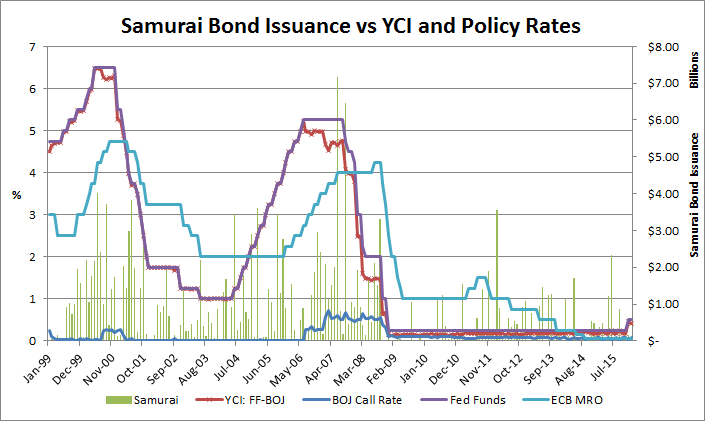
Japan was the first country to enter a Liquidity Trap, and to implement QE. However, in addition to purchasing Japanese assets on its Balance Sheet, the BOJ also purchased a significant amount of USTs - $400B between 2001 and 2004. While these investments were meant to deploy its Balance of Payments Surplus, the BOJ inadvertently supplied QE to the US, increasing US money supply. This was fortituous, as the YCI had declined during this period due to the Fed cutting rates - this QE from the BOJ, more than made up for the decline in Samurai, Net Call, and other forms of Japanese Carry.
I believe this to have been an important factor in the 2003 recovery in the US, resulting in a long rates rally, and playing a part in the mortage refinancing boom that occured, as well as not only limiting the decline in the US stock market, but also helping it turn around and rally.
Without the contribution of this QE in the 2001-2004 period, the YCI projected a lower SPX index. The SCI incorporates this Japanese QE, and as a result tracks the SPX!
When US QE was implemented, I had discussed my opinion as to why QE cannot work to recover asset prices, in the section called 'Bonds are not Assets' in the 2009 Crisis Note 'Excess Assets, Keynes, etc'. However, I missed that QE can directly increase the money supply by the amount of bonds purchased. The risk to QE is that much of the money supply created will get exported overseas, which also happened in the US in 2008 (and was discussed in another Crisis Note). What has surprised me has been the amount of QE the Fed has implemented - its Balance Sheet has increased by $4T!
While the ECB's activities have not been very relevant to US asset pricing to date, Mr. Draghi's recent comments to 'do what it takes' might change the ECB's contribution to Carry Trades and US asset pricing. ECB data is being shown for that reason, although it has not been incorporated into the Shah Carry Indicator as yet.
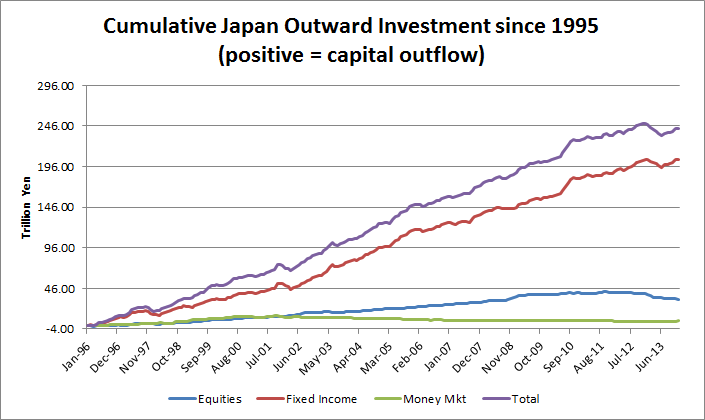
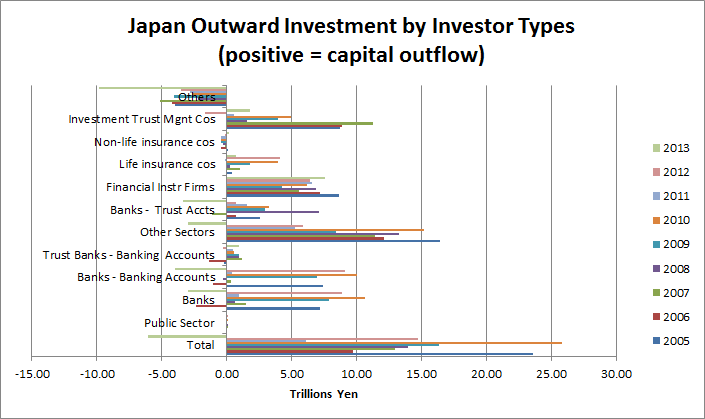
Outward Investment Flows
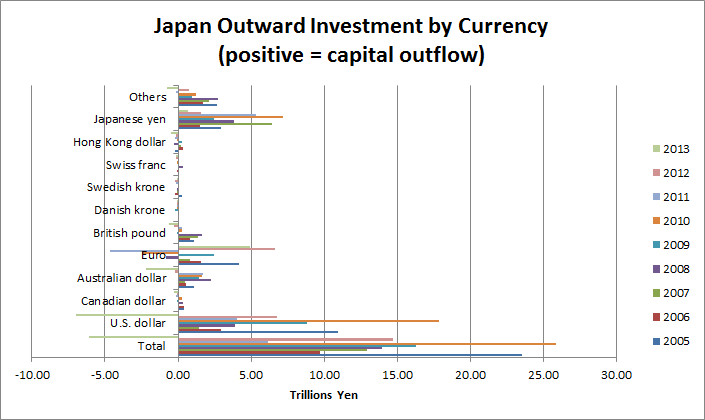
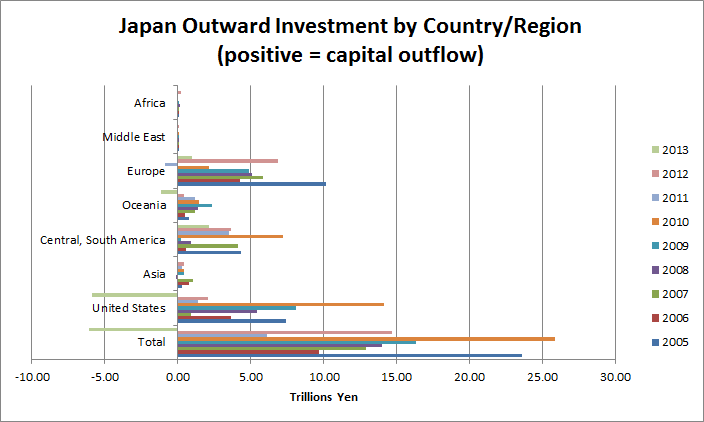
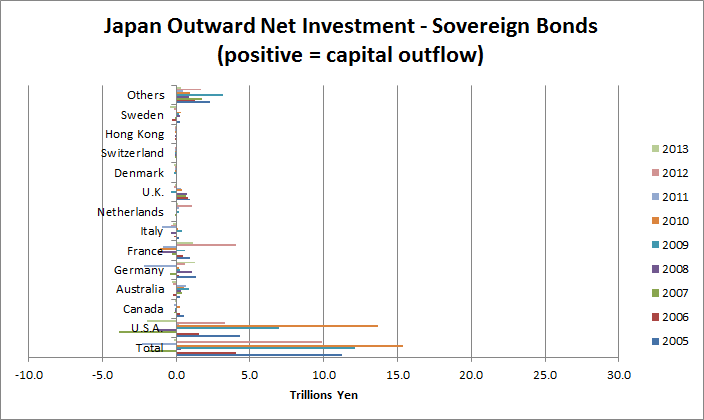
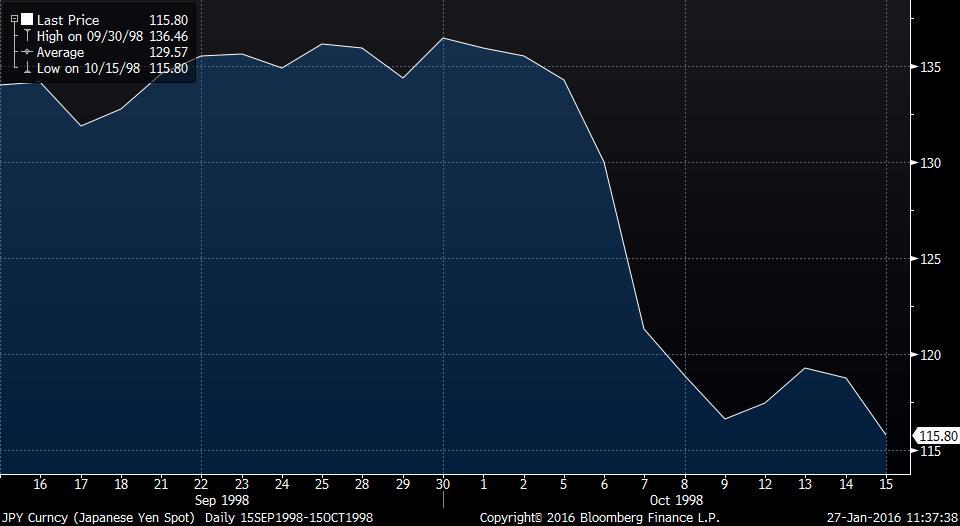
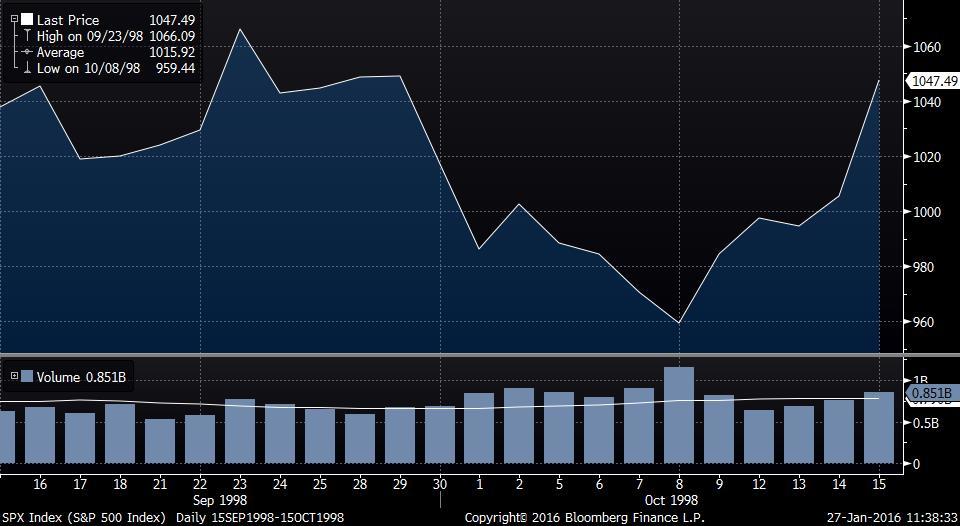
1993-1998: The Yen Carry Trade
...Tiger Management, until recently the largest such fund in the world. In its heyday in the summer of 1998, Tiger had more than $20 billion under management, considerably more than George Soros' Quantum Fund, and was reputed to be even more aggressive than Quantum in making plays against troubled economies. Notably, Tiger was perhaps the biggest player in the yen "carry trade"--borrowing yen and investing the proceeds in dollars--and its short position in the yen put it in a position to benefit from troubles throughout Asia. But when the yen abruptly strengthened in the last few months of 1998, Tiger lost heavily--more than $2 billion on one day in October--and investors began pulling out. The losses continued in 1999--from January to the end of September Tiger lost 23 percent, compared with a gain of 5 percent for the average S&P 500 stock. By the end of September, between losses and withdrawals, Tiger was down to a mere $8 billion under management.
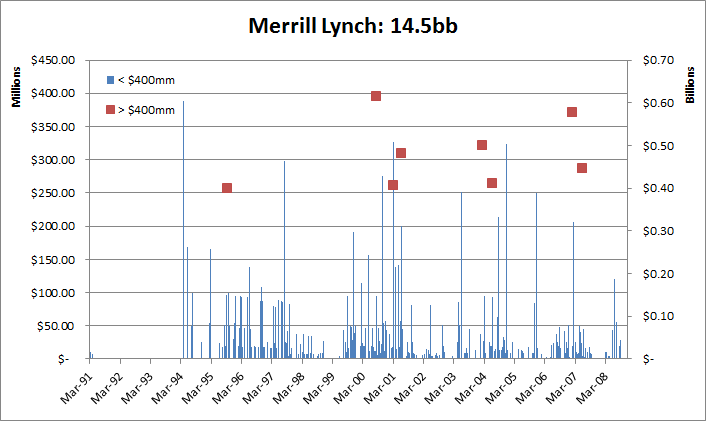
Transmission of Carry Trades: Merrill Lynch - a Proxy for US Brokerage Firms/Banks
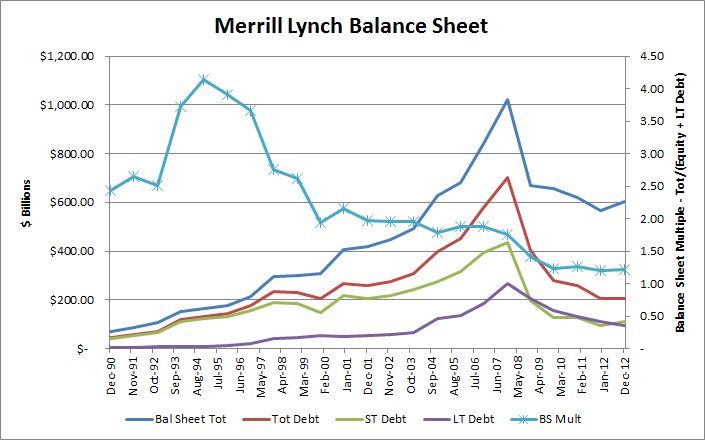
Summary:
- Yen Borrowing or Selling - Funding in Yen through banks, plus currency trading of of Yen for other currencies (Mrs. Watanable)
- Japanese Purchases of Bonds and Trusts denominated in foreign currencies (including EuroYen bonds).
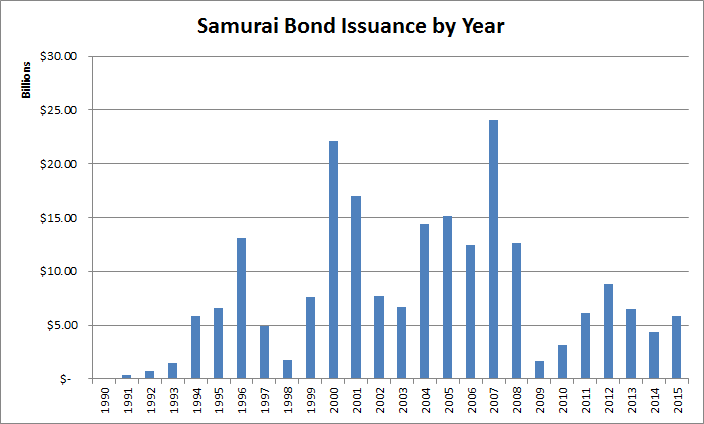
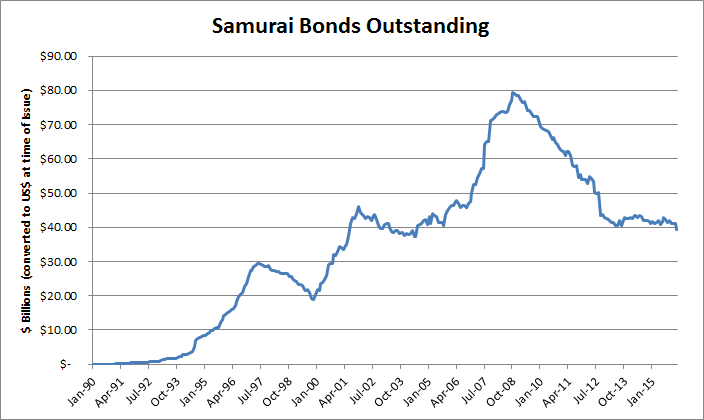
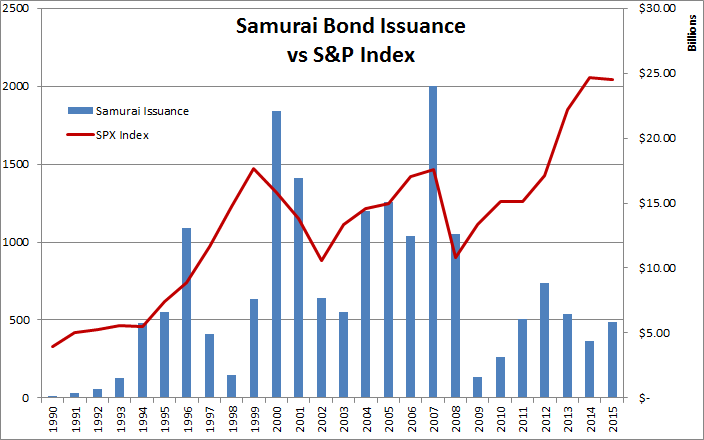
- Samurai bonds issuance by American financial institutions, increasing bank capital and leveraging the balance sheets of US banks.
- Quantitative Easing by the BOJ, exporting capital both directly (purchasing foreign Sovereign bonds) and indirectly (injecting money in to Japan's economy by purchasing JGBs, which then gets exported by the Japanese - see #2 above).
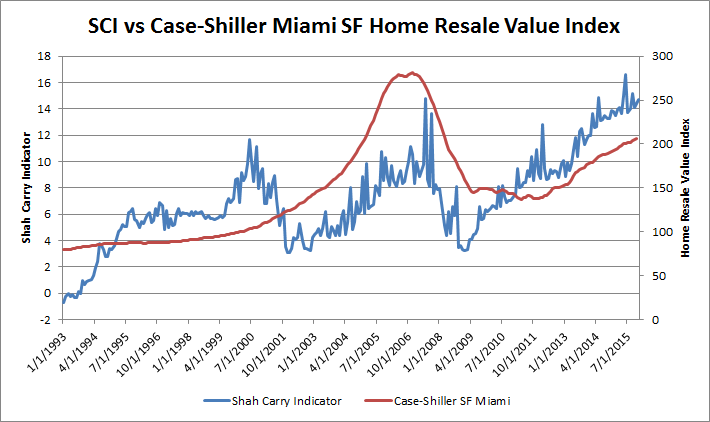
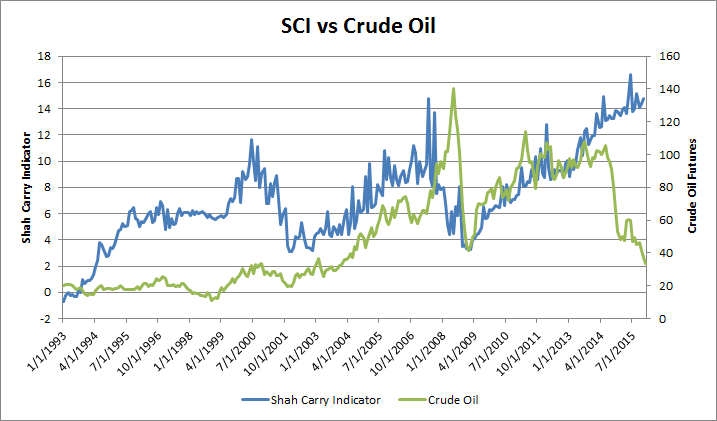
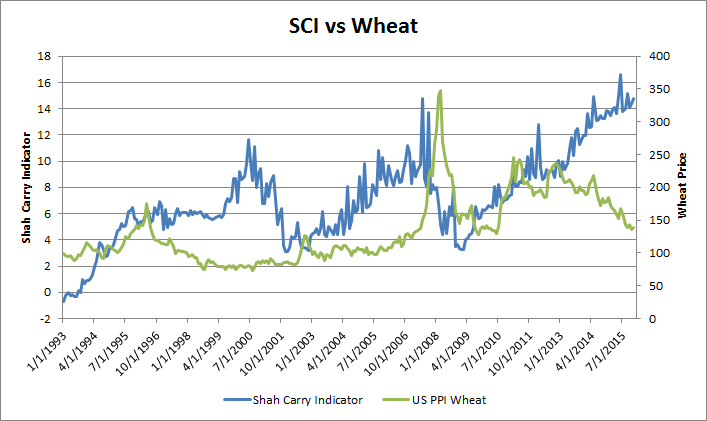
Section 2: The Pricing of Assets
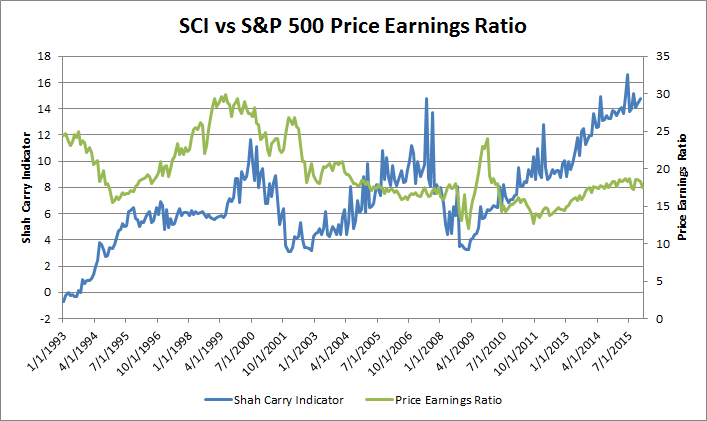
SCI and the S&P 500 Price Earnings Ratio
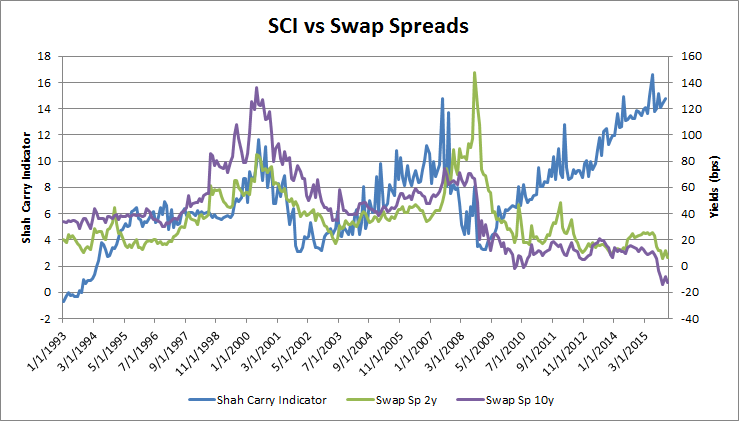
SCI and US Treasury Bonds
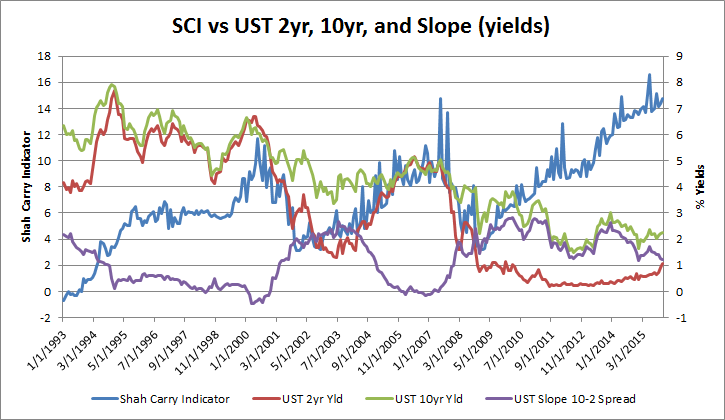
... For one, market yields had increased quite sharply in anticipation of Fed tightening in 2004. Market yields were much lower in mid-March 2004, before investors began to worry about a change in Fed policy. Some yields increased as much as 100 bps between mid-March and late-June.


"The weak job market should concern every American. It imposes hardship on people.."
Section 3: The Failure of Macro Economics
- - Central banks derive their power from the fact that they are monopoly providers of “high powered” money (base money).
- - Central banks choose the price (rate) at which they lend high powered money to the private sector - the Policy Rate eg. Fed Funds Rate or Uncollateralized Overnight Call Rate.
- - This official rate is transmitted to other market rates via the banking system to varying degrees, and impacts assets prices and expectations, as well as the exchange rate.
- - These changes in turn effect spending, savings, and investment behavior, which impacts the demand for goods and services.
- - Monetary policy works via its influence on aggregate demand in the economy. Monetary policy thus determines the general price level, and the value of money i.e. the purchasing power of money. (Inflation is thus a monetary phenomenon. )
- - Changes in the policy rate lead to changes in behavior of both individuals and firms, which when added up over the whole economy generate changes in aggregate spending.
- - Total domestic expenditure in the economy is equal to the sum of private consumption expenditure, government consumption expenditure and investment spending. This, plus the balance of trade (net exports) is equal to GDP.
- - Monetary policy changes affect output and inflation, as well as inflation expectations. - Inflation expectations influence the level of real interest rates and so determine the impact of any specific nominal interest rate. They also influence price and money wage setting, and so feed into actual inflation in subsequent periods.
- - Money supply plays a role in the transmission mechanism of policy, but is not a policy instrument nor a target, as the central bank has an inflation target, and uses monetary aggregates as indicators only.
- - There is a positive relationship between monetary aggregates and the general level of prices. - “Monetary growth persistently in excess of that warranted by growth in the real economy will inevitably be the reflection of an interest rate policy that is inconsistent with stable inflation. So control of inflation always ultimately implies control of the monetary growth rate. However, the relationship between the monetary aggregates and nominal GDP ..appears to be insufficiently stable (partly owing to financial innovation) for the monetary aggregates to provide a robust indicator of likely future inflation developments in the near term.”
- - Shocks to spending can have their origin in the banking system, that are not directly caused by changes in interest rates
- – Examples include declines in bank lending caused by losses of capital on bad loans: a credit crunch.
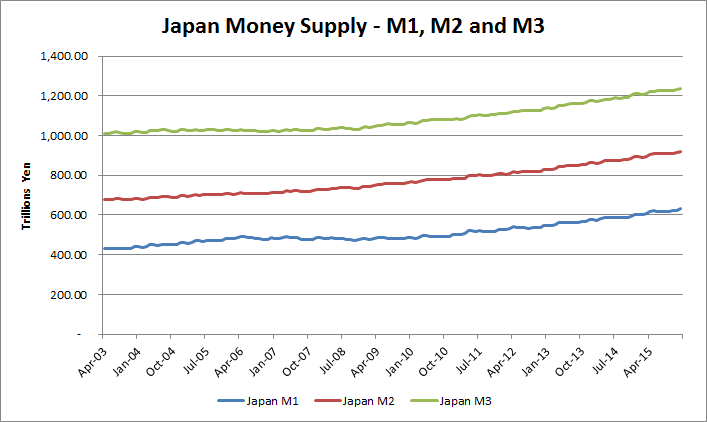
- - M1 is usually a narrow definition - coins and notes in circulation
- - M2 is typically M1 plus short term bank deposits, savings and checking accounts, money market funds, etc.
- - MZM - Money Zero Maturity - A measure of the liquid money within an economy. MZM represents all money in M2 less the time deposits, plus all money market funds
- - M3 is M2 plus longer term deposits
- - Some countries have even broader definitions.
In terms of the quantity theory of money, we may say that the velocity of circulation of money does not remain constant. “You can lead a horse to water, but you can’t make him drink.” You can force money on the system in exchange for government bonds, its close money substitute; but you can’t make the money circulate against new goods and new jobs.
- * Inflation Target
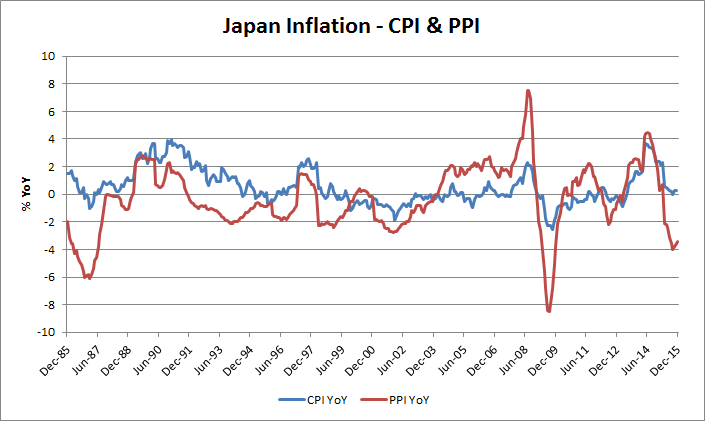
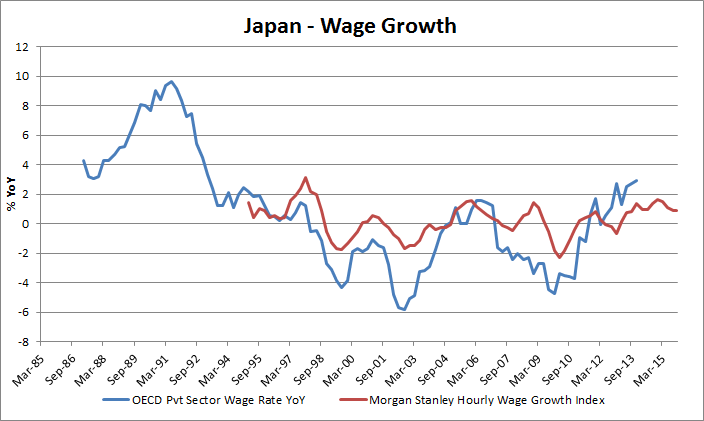
- There are 3 types of inflation that matter
- - Goods Price Inflation
- - Wage Inflation
- - Asset Inflation
- * Full Employment
- - measuring employment and unemployment is a favorite sport of economists
- - the headline unemployment number does not represent reality
- * GDP growth
- - we need to look into the components of GDP growth.
- - it is relatively easy for an administration to increase the size of government, but if it is not productive, it will not lead to Velocity of money.
" The trouble is, Japan is 100 mm people on a few islands, and if they allowed their industrial base to hollow out, the country would become indefensible without projecting military strength throughout Asia, not to mention a banking system with significant resilience and reach as well."


Section 4: An Alternate Reality - When Japan supplies your Money, are Fed Fund Rate Cuts counterproductive.
Policy Brainstorming